
Ilona brings over 20 years of experience having delivered web solutions for brands such as the BBC, O2 and SONY to name but a few.
Follow
A website is a living entity. And as such, it needs regular attention and creative input. Does your copy really communicate to your target audience? Are the calls to action visible and clear? Are your users confused by vaguely designed elements of user experience?
Using heat maps is a great way to discover answers to the above questions. Heat maps are graphical representations of the actions that your visitors have taken on your website.
The software we use at Moove Agency for generating heat maps is called Crazy Egg and the pricing starts from as little as $9 per month.
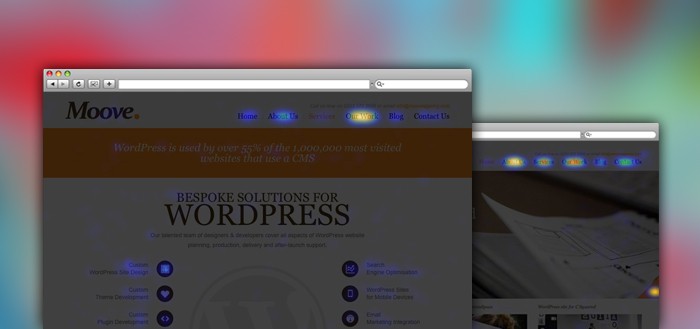
We put heat maps to the test after a redesign of our own website. We wanted to track how users reacted to the new design so we ran a couple of tracking tests on the main pages.

On the homepage, users behaved exactly as we expected. People clicked on the calls to action on the slideshow or on the main navigation links.
However, one thing that did catch our attention was that people were actually clicking on the navigational arrows on the slideshow to move from one slide to the other. We recently considered dropping these elements when designing carousels for our websites. We thought that by keeping the designs clean and simple they would be more user-friendly. What we didn’t take into account was how much users like to be in control of their experience when using sites. So we’ve reverted to including not only the navigational arrows with every slideshow but we often add additional visual elements to aid user control, such as confirming how many slides are in the slideshow.
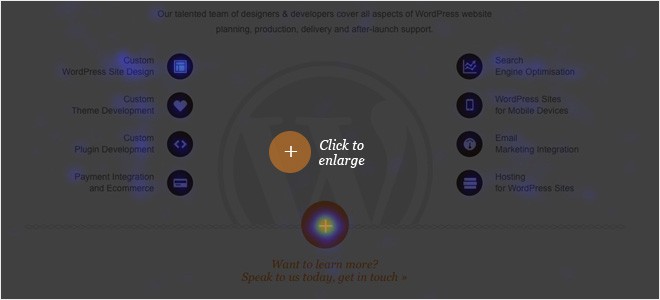
We ran another tracking test on the services page. The immediate problem we faced was users clicking the big orange plus button, presumably expecting more information. Unfortunately, this doesn’t happen and it leads the user straight to the contact page. We did originally create the button with a view to it providing more information but due to the impending launch date for the site we opted for a simpler solution and decided to add the animation later. Later didn’t happen unfortunately so it’s an issue that we need to resolve. The heat map proved to be a timely reminder of a task that needs to be completed.
We ran tracking tests on About us page and individual portfolio pages too. The results showed that users behaved exactly as we expected them when interacting with our site which confirms that our design team did an excellent job in creating an intuitive user experience.
Using software like CrazyEgg is a useful way of testing your websites design, copy and the experience it offers to your users.
If you lack the time or technical skills to install the Crazy Egg software, let us know. Our team can assist you with the setup and subsequent interpretation of the results. Drop us an email or call our team on 020 3372 5696.